

A recurring production defect, an unexpected machine breakdown, or a growing number of customer complaints can quickly affect business performance. While fixing the immediate issue may restore operations temporarily, the same problem can return if its underlying causes remain unresolved. This is where an Ishikawa Diagram Tool Japan approach becomes valuable, helping teams investigate problems systematically and identify opportunities for lasting improvement.
Originally developed by Japanese quality expert Kaoru Ishikawa, the fishbone diagram remains a widely used method for cause-and-effect analysis. Today, organizations can combine this proven technique with digital problem-solving systems to improve collaboration, strengthen accountability, and turn findings into measurable corrective actions.
What Makes an Ishikawa Diagram Useful?
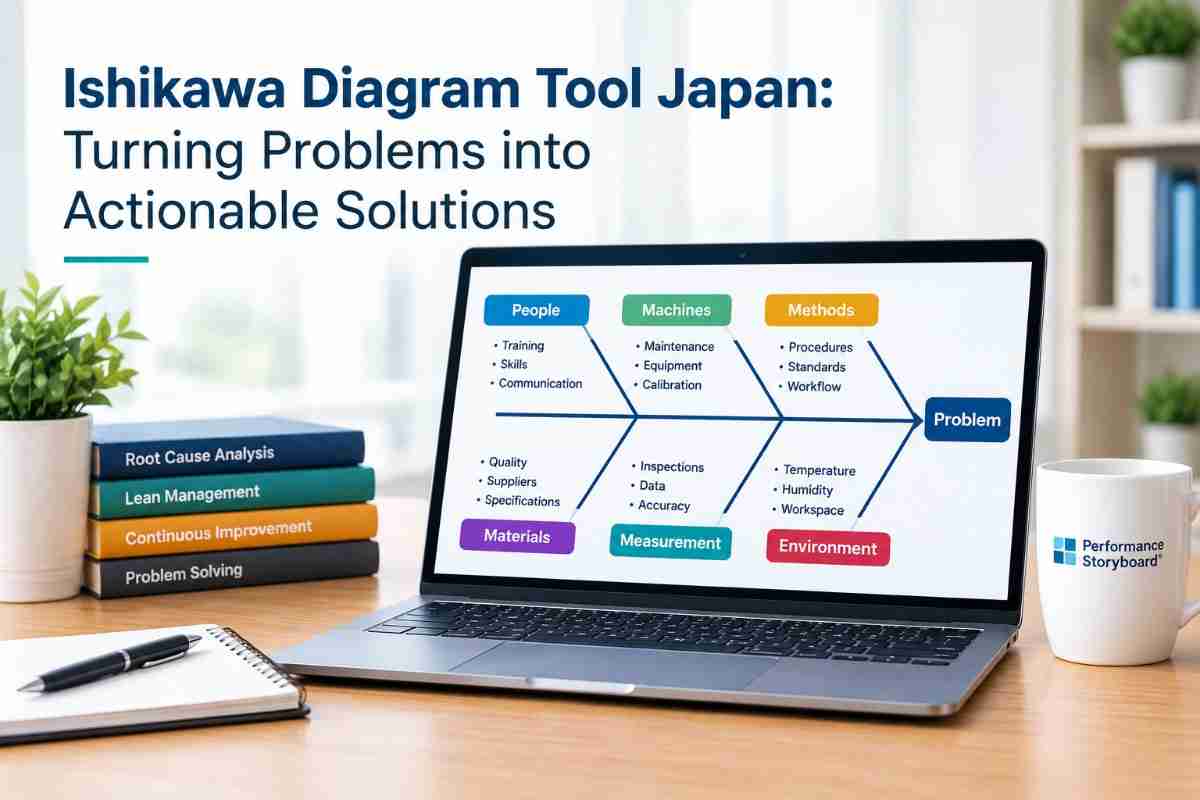
An Ishikawa diagram, also known as a fishbone diagram or cause-and-effect diagram, provides a visual framework for investigating why a particular problem occurs. The problem is placed at the head of the diagram, while branches represent categories of potential causes and their contributing factors.
Rather than immediately deciding who or what is responsible, teams examine different aspects of a process before reaching conclusions.
For example, if a manufacturing company experiences a sudden increase in defective products, its investigation might consider:
- People: Are employees adequately trained, and are responsibilities clear?
- Machines: Is equipment properly maintained and calibrated?
- Methods: Are standard operating procedures consistent and practical?
- Materials: Are raw materials meeting the required specifications?
- Measurement: Are inspection methods and recorded data reliable?
- Environment: Are temperature, humidity, or workplace conditions affecting quality?
These categories, commonly known as the 6M framework, help teams explore the problem from multiple perspectives. They also reduce the risk of overlooking less obvious causes that may contribute to repeated failures.
From Problem Identification to Practical Solutions
Creating a diagram is only the beginning. Its real value comes from how teams investigate the identified causes and translate their findings into meaningful action.
Consider a factory where product defects have increased over several weeks. An initial assumption might be that operators are making mistakes. However, a structured fishbone analysis could reveal several contributing factors, including inconsistent machine settings, unclear work instructions, and variations in incoming materials.
Instead of introducing additional inspections alone, the team can investigate each possibility, review production records, and verify which factors genuinely contribute to the defect.
A practical process involves five steps:
- Define the problem clearly. Describe the issue using measurable information, such as defect rates, downtime, or customer complaints.
- Organize possible causes. Select relevant categories and invite employees from different functions to contribute.
- Investigate contributing factors. Break broad causes into specific, testable explanations.
- Verify the evidence. Use observations, process records, measurements, and data to distinguish likely causes from assumptions.
- Assign corrective actions. Establish responsibilities, deadlines, and criteria for checking whether the solution works.
This approach makes the Ishikawa diagram more than a brainstorming exercise. It becomes a starting point for evidence-based decisions and continuous improvement.
Why Digital Problem-Solving Tools Matter
Paper-based diagrams can work well for small investigations. However, complex problems involving several departments, multiple production sites, or numerous corrective actions can become difficult to coordinate manually.
A digital solution can make it easier to document findings, communicate responsibilities, monitor progress, and retain knowledge for future investigations.
For organizations seeking to connect root cause analysis with daily operational management, Performance Storyboard offers a broader approach. Its modular Lean Management System connects key performance indicators (KPIs), daily management, Total Productive Maintenance (TPM), audits, and structured problem-solving within an integrated digital framework.
Its Advanced Problem Solving (APS) capabilities include Ishikawa diagrams, 5 Whys analysis, A3 problem-solving, PDCA cycles, and Kanban-based task flow. These methods help teams investigate issues, structure their work, and coordinate corrective actions.
Explore the Advanced Problem Solving software to understand how these capabilities can support a more consistent problem-solving process.
Connecting Root Causes with Corrective Actions
One of the biggest challenges in quality management is ensuring that an investigation produces lasting results. Teams may identify a plausible cause and implement a solution, only to discover that the problem returns a few weeks later.
This often happens when corrective actions are not adequately verified or when improvements are not incorporated into standard working practices.
An effective problem-solving process should answer four important questions:
- What caused the problem, and what evidence supports that conclusion?
- What action will eliminate or control the verified cause?
- Who is responsible for implementing the action, and when must it be completed?
- How will the team confirm that the improvement is effective and sustainable?
For example, if an investigation identifies inconsistent machine maintenance as a contributing factor, the corrective action might involve revising maintenance standards, clarifying ownership, and introducing regular compliance checks.
Performance Storyboard® supports structured problem-solving by connecting identified deviations, root causes, and corrective actions with defined responsibilities and follow-up. Its wider management framework helps organizations move beyond documenting an issue toward managing the execution of improvements.
Learn more about its Lean Management System and how structured daily routines can help connect operational problems with performance improvement.
Combining Ishikawa Analysis with Other Methods
The fishbone diagram is especially effective when used alongside complementary problem-solving techniques. Each method serves a different purpose, and combining them can produce a more complete investigation.
- 5 Whys analysis: Repeatedly asks why a problem occurred to explore deeper contributing factors.
- 8D problem-solving: Provides a structured, team-based process for investigating complex issues, implementing corrective actions, and preventing recurrence.
- PDCA cycle: Organizes improvement through planning, implementation, evaluation, and adjustment.
- A3 problem-solving: Summarizes the problem, analysis, countermeasures, and follow-up in a clear format.
For instance, an Ishikawa diagram may reveal several possible reasons for equipment downtime. The 5 Whys method can then help investigate a particular cause, while an 8D workflow can guide the wider team through verification, corrective action, and recurrence prevention.
The objective is not to use every available tool for every problem. It is to select methods that fit the complexity of the issue and support a disciplined path from investigation to implementation.
Building a Culture of Continuous Improvement
Sustainable improvement depends on more than software or diagrams. It requires teams to discuss problems openly, use evidence rather than assumptions, and treat recurring failures as opportunities to improve systems.
Managers can reinforce this culture by reviewing unresolved issues regularly, ensuring that corrective actions have clear owners, and checking whether completed improvements deliver the expected results.
Digital systems can strengthen these habits by making information accessible, improving visibility across departments, and helping teams maintain a record of decisions and actions.
For organizations in Japan and elsewhere, an Ishikawa Diagram Tool Japan strategy can therefore be part of a wider operational excellence initiative. The greatest benefit comes when root cause analysis is connected to measurable objectives, consistent execution, and ongoing learning.
Frequently Asked Questions
What is an Ishikawa diagram used for?
An Ishikawa diagram is used to identify and organize potential causes of a specific problem. It helps teams investigate quality defects, process delays, equipment failures, and other operational issues systematically.
What is the difference between an Ishikawa diagram and a fishbone diagram?
There is no fundamental difference. Both terms describe the same cause-and-effect analysis tool developed by Kaoru Ishikawa. The name fishbone refers to the diagram’s resemblance to a fish skeleton.
How do you create an Ishikawa diagram?
Define the problem, select relevant cause categories, brainstorm potential contributing factors, examine the evidence, and investigate the most credible causes. Once the root causes are verified, assign corrective actions and monitor their effectiveness.
What is the 6M method in a fishbone diagram?
The 6M method groups potential causes into Manpower, Machine, Method, Material, Measurement, and Mother Nature (Environment). It is commonly used in manufacturing, although categories can be adapted to suit other industries.
Can an Ishikawa diagram help prevent recurring problems?
Yes. It helps teams investigate underlying causes rather than focusing exclusively on symptoms. However, preventing recurrence also requires verifying causes, implementing appropriate corrective actions, and monitoring results over time.
Is digital problem-solving software better than a manual fishbone diagram?
A manual diagram can be sufficient for a straightforward investigation. Digital problem-solving software becomes particularly useful when teams need to coordinate multiple actions, maintain records, establish ownership, and connect root cause analysis with broader management routines.
Turn Analysis into Action with Performance Storyboard®
Identifying a problem is important, but lasting improvement depends on what happens next. By combining Ishikawa analysis with evidence-based investigation, accountable corrective actions, and consistent follow-up, organizations can address operational weaknesses more effectively.
Performance Storyboard helps connect structured problem-solving with daily management and continuous improvement. Visit the official Performance Storyboard website to explore its capabilities and discover how your organization can strengthen problem-solving discipline and turn identified issues into sustainable operational improvements.